


Filling the Gap: Part 3
Nov. 21, 2017
US crude has been making its way to Eastern markets in high volumes this year with official monthly data from the US Energy Information Administration (EIA) indicating an average of 896,000 b/d through August 2017. In the past, a majority of US crude was piped north into Canada; in fact, from 2010 to 2015 an average of 94% of US crude was exported to Canada. The removal of the ban on US crude exports at the tail end of 2015 allowed this figure to fall to 61% in 2016 amid higher flows to Northern Europe, the Caribbean, and Asia. This year, we have observed 34% of US crude making its way to Canada through the first eight months of 2017, while 33% was sent to Asia (mostly China) and 22% to Europe.
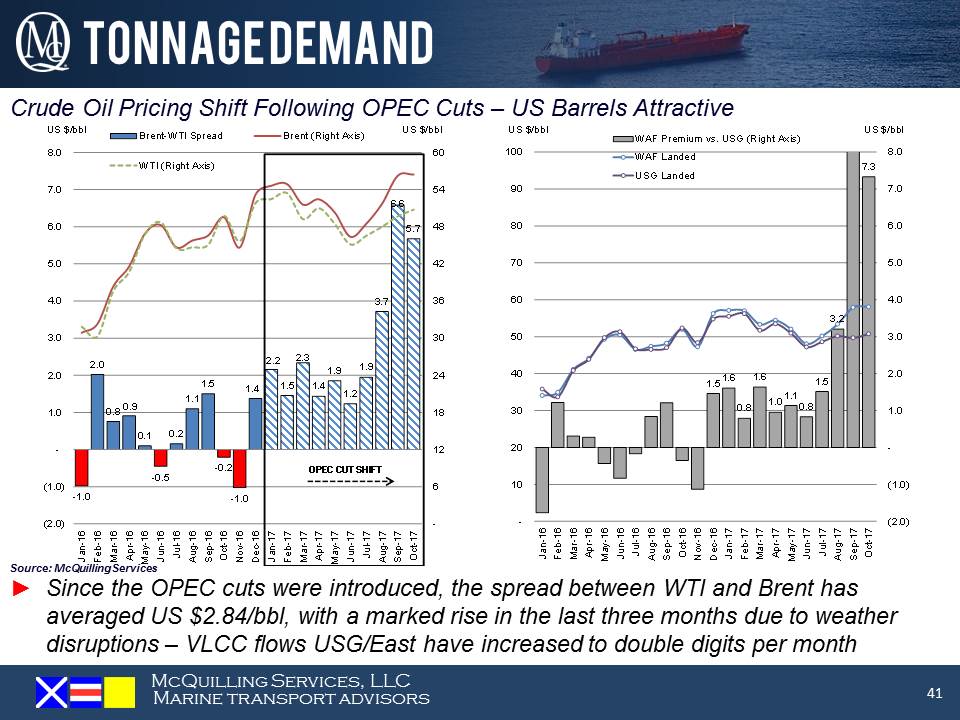
VLCC ton-mile demand out of the N. American Gulf Coast to the Far East and South East Asia is on track to grow considerably this year before expanding at an average annualized rate of 6% over 2018-2021. The main driver behind US crude exports has been the pricing relationship between WTI to global crude benchmarks. On track to expand by over 600,000 b/d this year, North American crude supply has grown with higher US and Canadian crude output, placing significant pricing pressure on the WTI crude benchmark. This, coupled with OPEC production cuts reducing Middle East crude supply and boosting the price of Dubai-linked crudes, has incentivized Eastern refiners to expand their crude sourcing to non-traditional players with more competitive pricing, especially in a low freight rate environment. These arbitrage plays have been crucial to the survival of the US crude export market and we expect a similar trend next year, on the basis of continued OPEC productions cuts next year as well as an 840,000 b/d rise in North American crude supply. The slide below depicts the recent widening of the Brent-WTI pricing differential (left), as well as the lower cost advantage refiners, gain in sourcing US crude over West African crude (right).
Comments
You need to login to comment.


