


McQuilling Forecast Performance - 2017
Jan. 18, 2018
Our overall forecast performance for 2017 was within 6.4% of actual market freight rates across the 19 trades that were monitored in the 2017-2021 Tanker Market Outlook. This was achieved throughout a year that could be characterized by significant tanker oversupply, geopolitical tensions and evolving oil market fundamentals. This metric is a measure of the absolute average of the total variation on a trade-by-trade basis, regardless of whether we overcast or undercast the market on each trade. In other words, it is a measure of how close we came, on average, to the actual spot market rates observed on each trade.
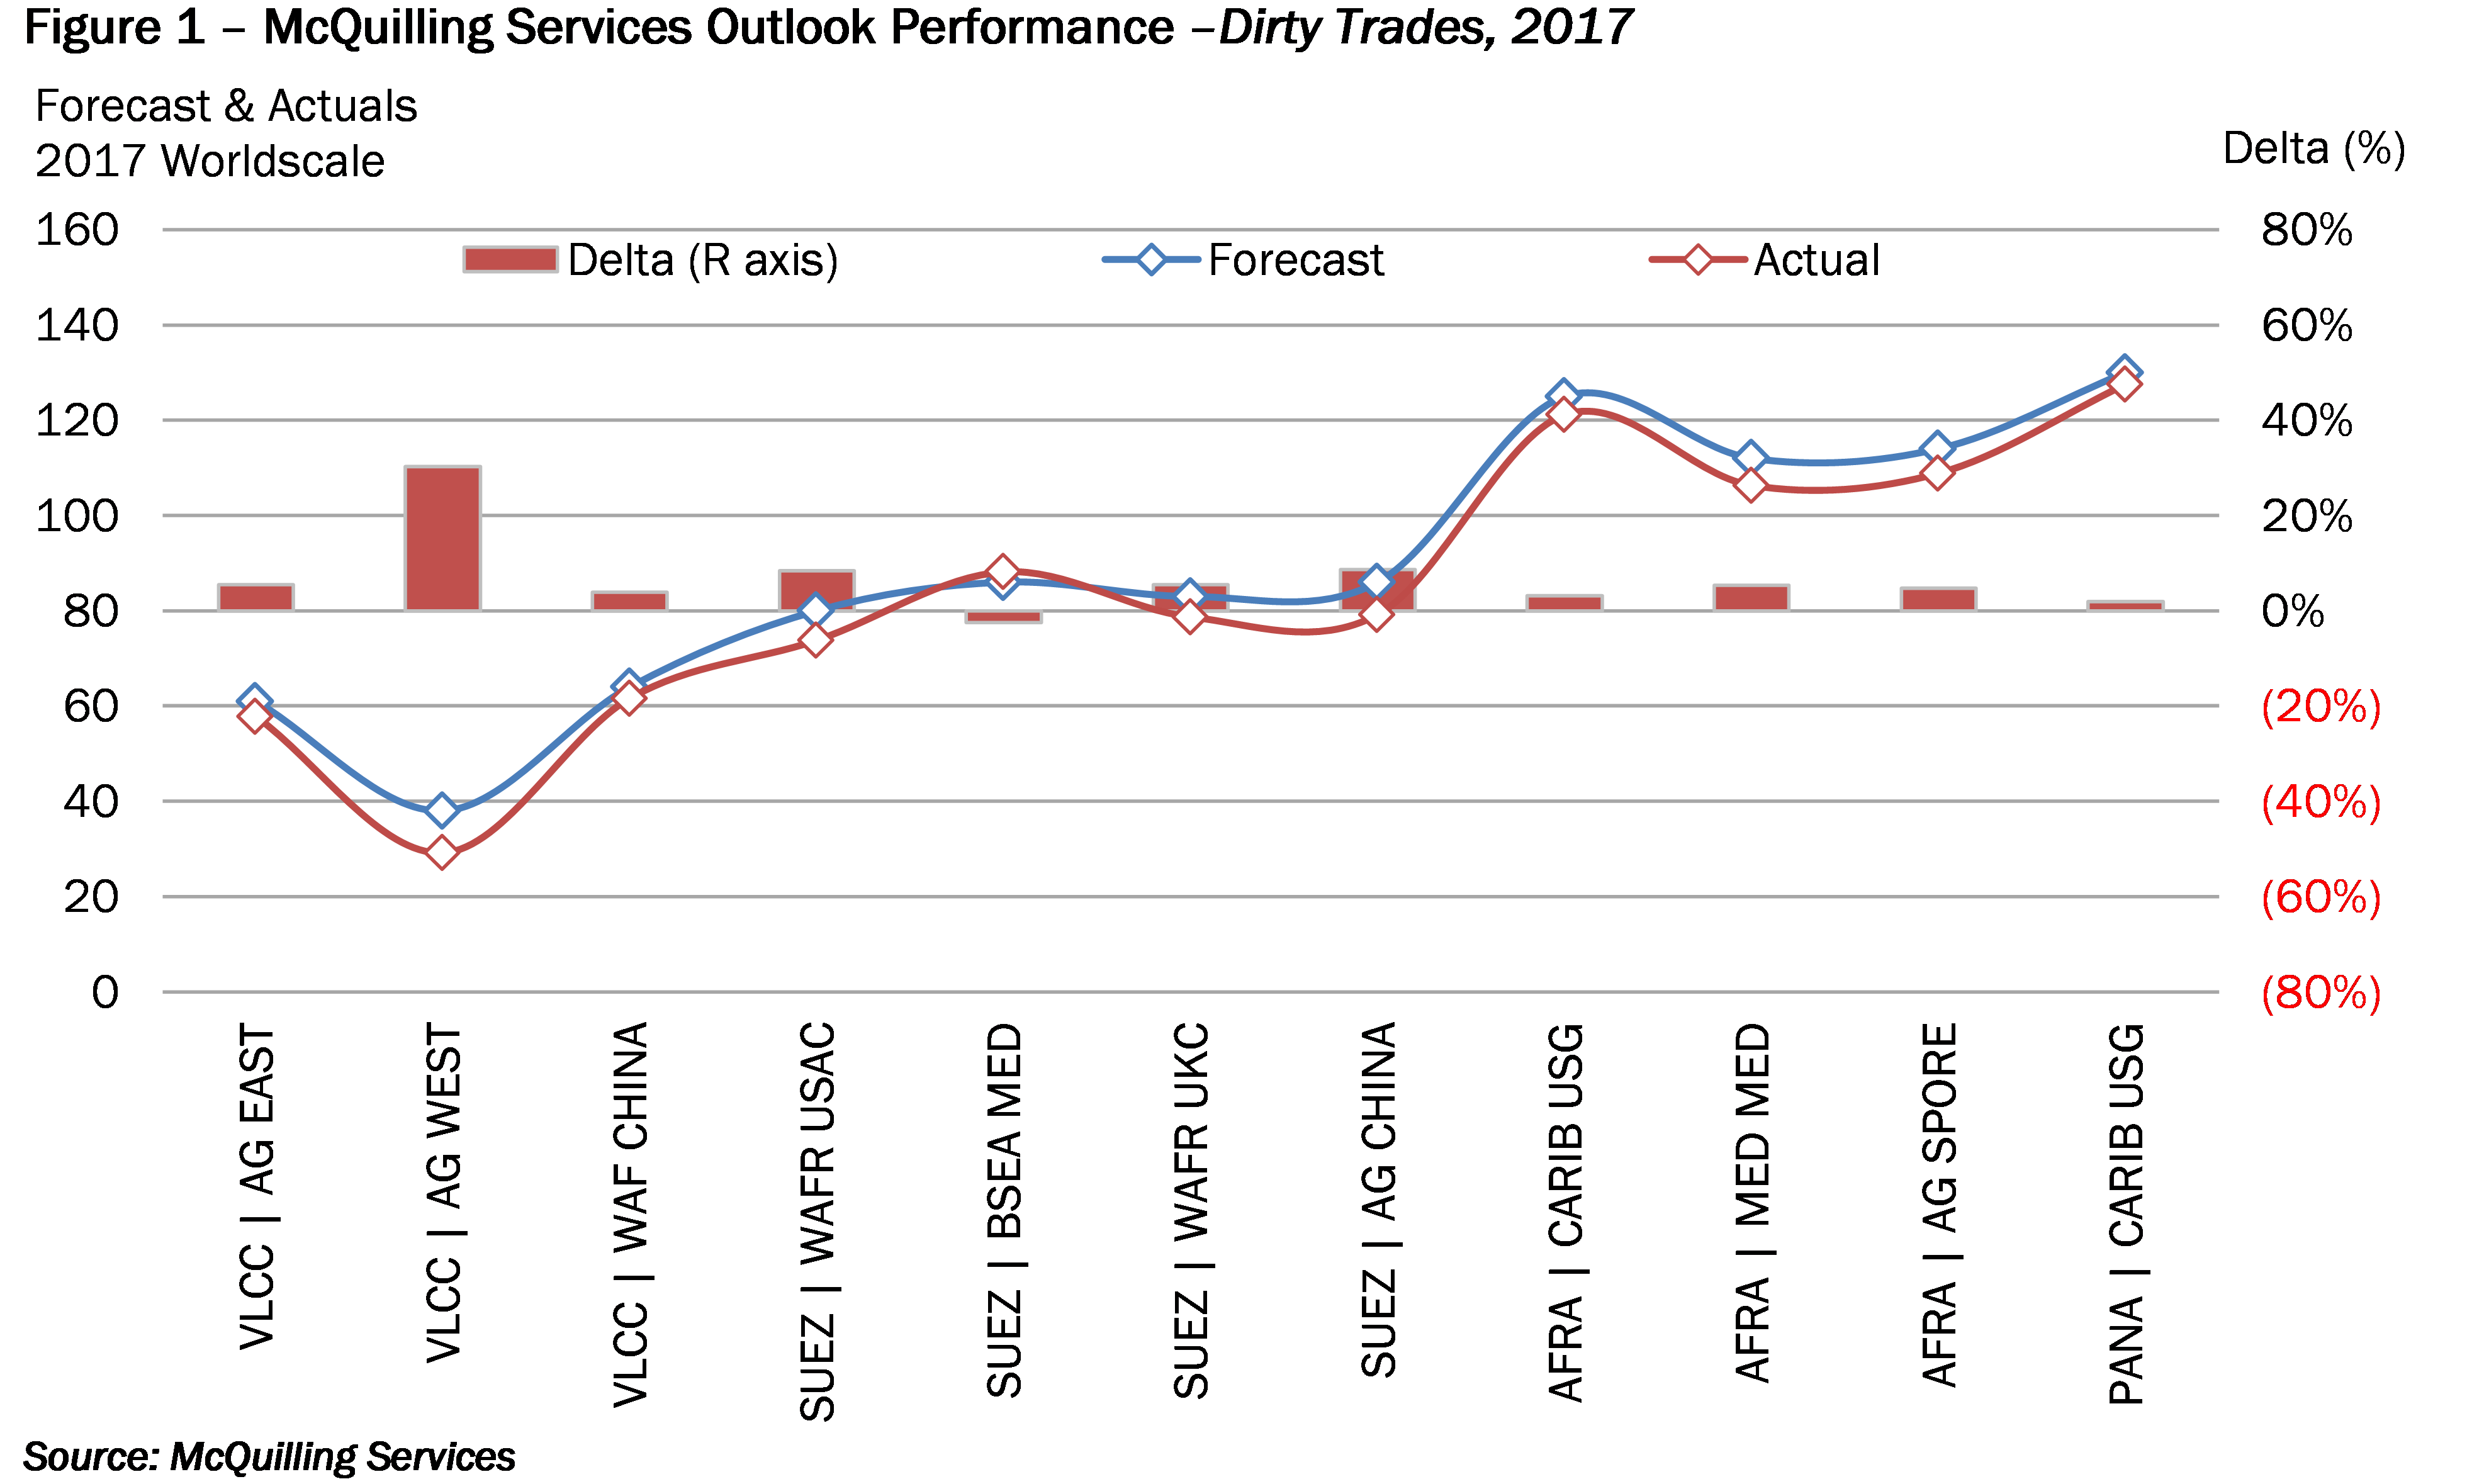
Our January 2017 forecasts for the 12 dirty trades tracked within 6.8% of actual market levels on an absolute basis. Freight rates were largely pressured by the continued oversupply of tonnage in the market as well as a weaker than expected winter season, which traditionally provides a bump in rates. The greatest variation was our overcast of AG/West (TD1), which came under more demand pressure than we originally anticipated and our forecasts were 30% higher than actual market levels. The VLCC forecasted rates overcast actual market conditions by 5% on the AG/Far East route (TD3), 4% on the West Africa/East route (TD15) and 1% on the Caribbean/Singapore route. The only trade to experience higher rates than our original forecast was TD6 (Black Sea/Mediterranean), which performed 2% higher than our expectations. The Suezmax forecast rates overcast by 8% on the West Africa/US Atlantic Coast (TD5), and 5% on the West Africa/UK Continent (TD20) (Figure 1).
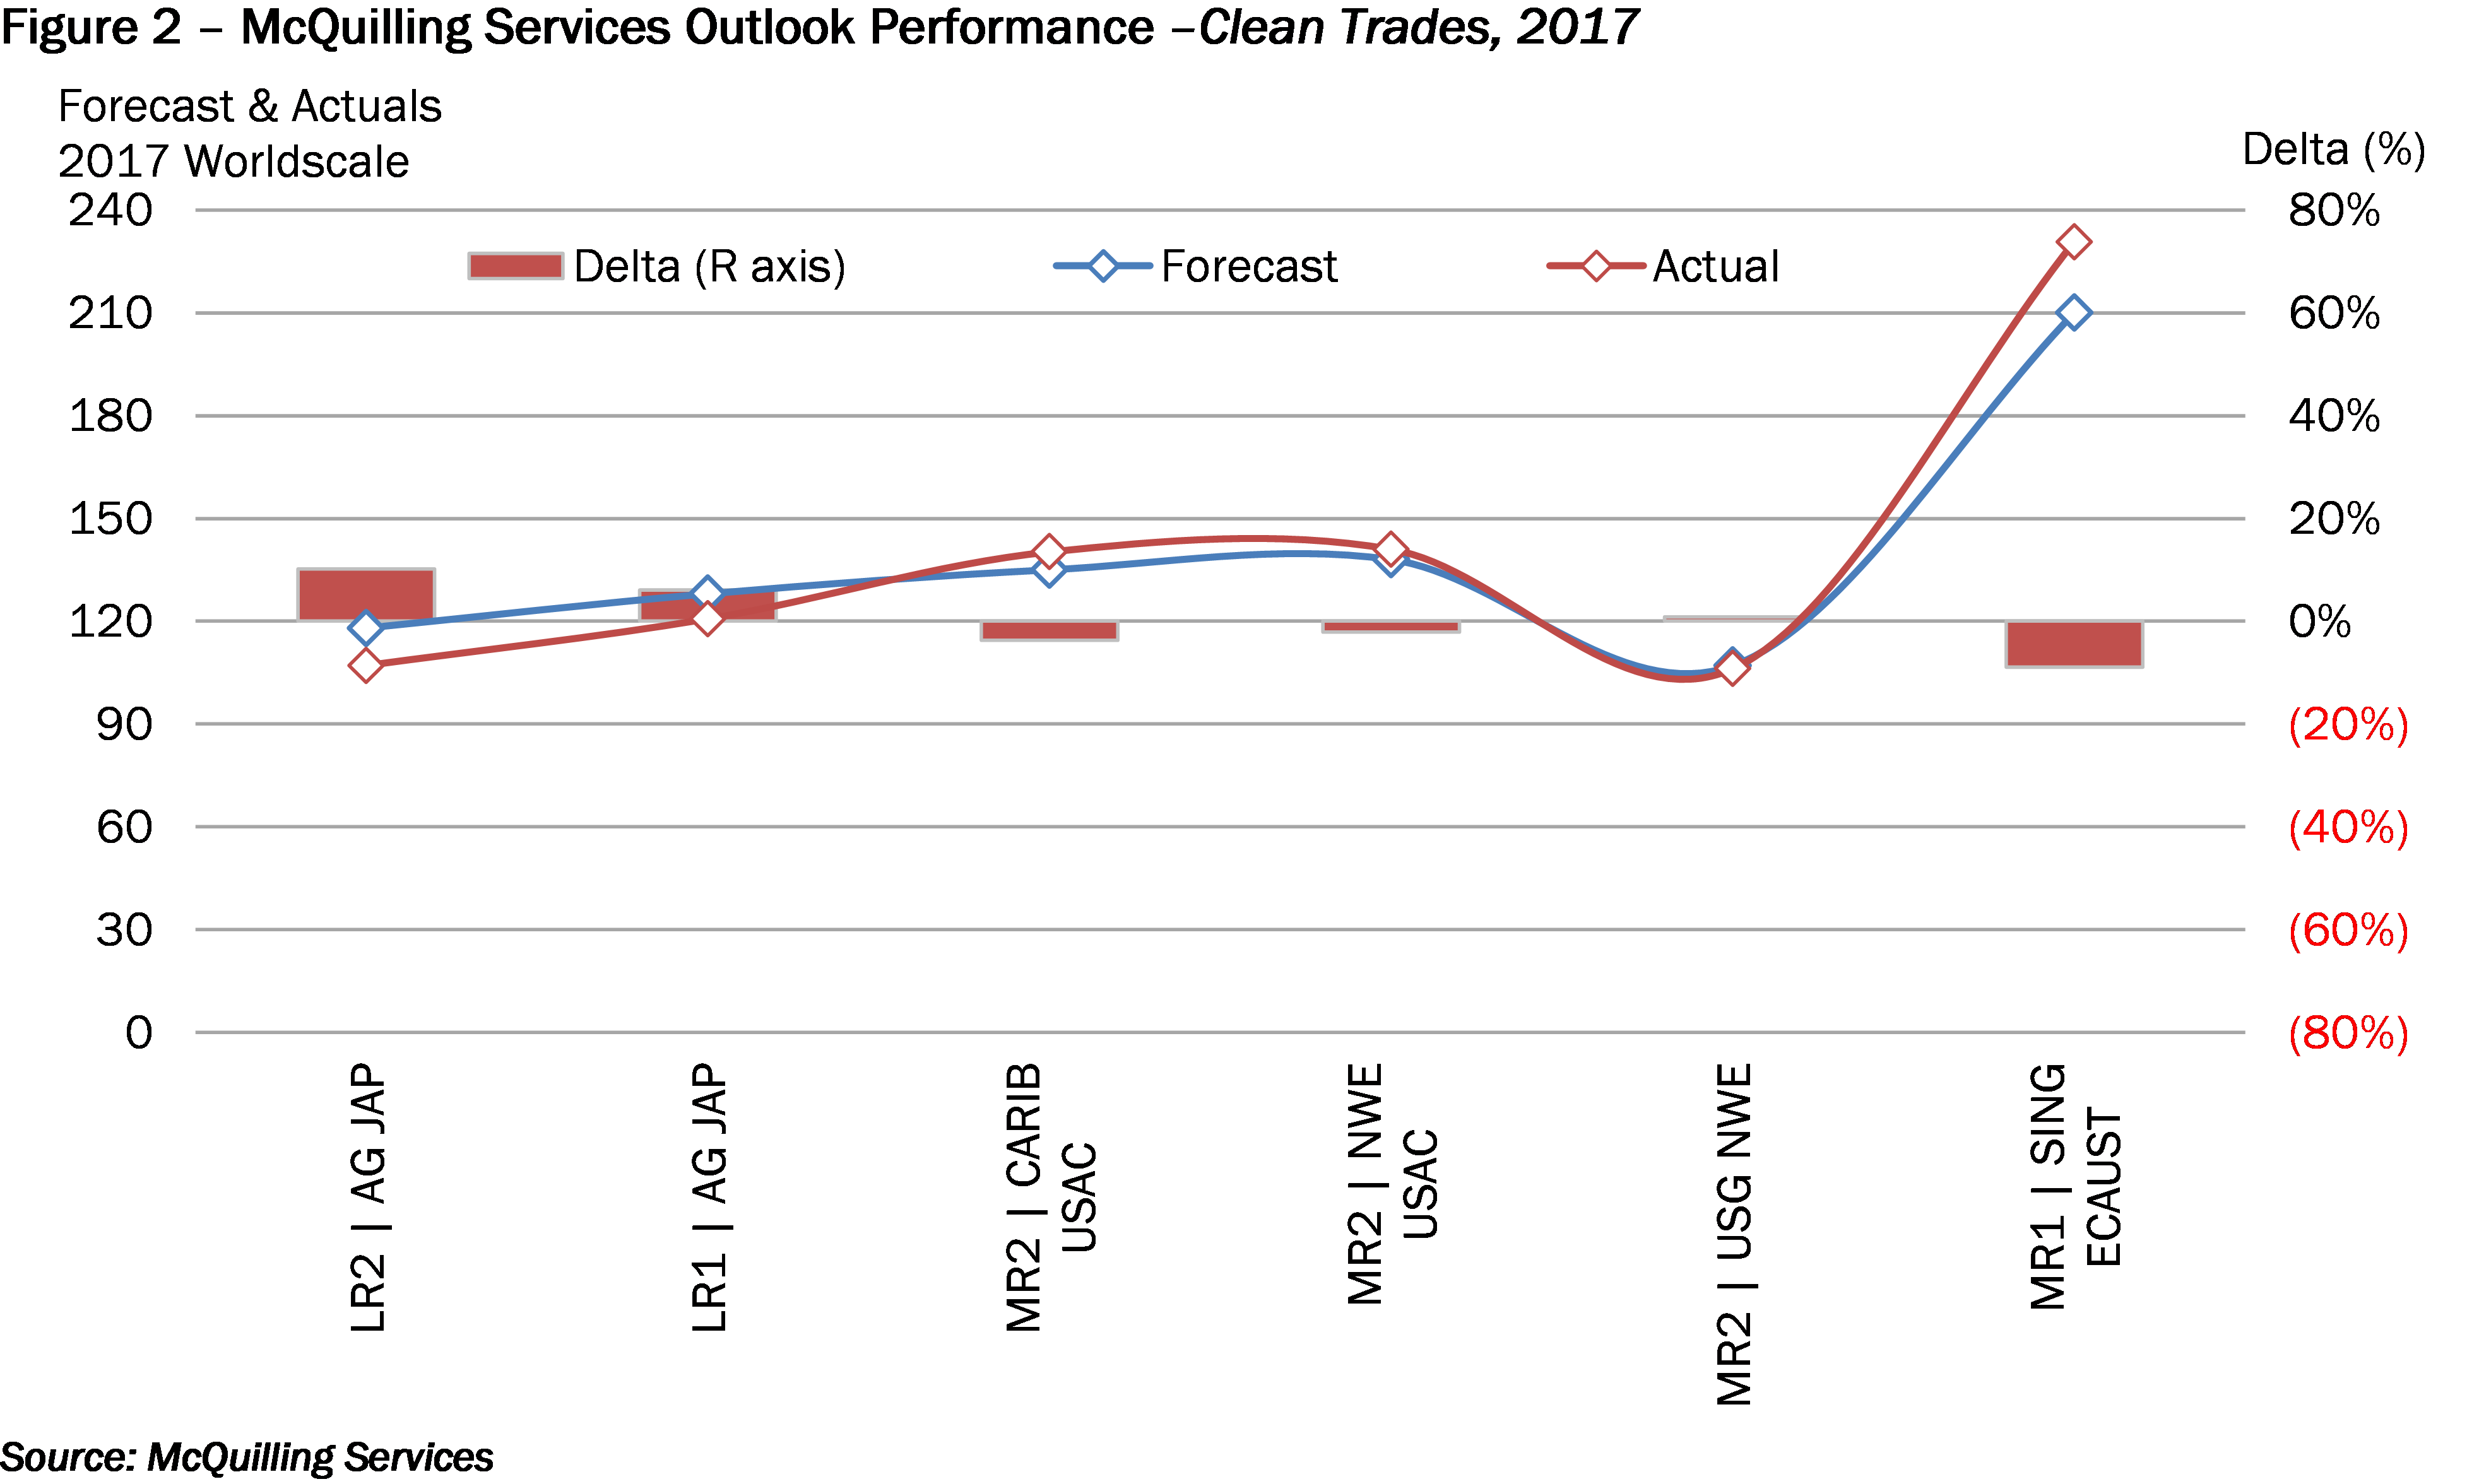
For the seven clean trades monitored, we overcast rates by 5.9%. The greatest variation was observed on AG/Japan (TC1) for LR2s, which we overcast by 10%, while AG/Japan (TC5) for LR1s was overcast by just 6%. The MR sector generally performed higher than our expectations, excluding USG/UKC (TC14) which averaged <1% lower than our January 2017 forecast. The Singapore/EC Australia (TC7) and USG/Caribbean routes experienced the largest variation from our forecasts with actual market levels 9% higher for both trades (Figure 2).

Comments
You need to login to comment.


