


Tonnage on the Water
Jan. 15, 2018
A beginning inventory figure for the eight vessel classes we track is extracted from our proprietary database during the Tanker Market Outlook process. For the clean sectors, we historically calculated supply for product carriers and IMO 3 class vessels only; however, are now including the Chemical IMO 2 fleet due to its increasing utilization for the marine transportation of refined products amid volatile chemical tanker demand. Chemical ships with an IMO II/III designation are evaluated on a monthly basis to determine whether their classification has changed and updates are reflected in our inventory numbers.
Throughout the year, we monitor additions to the fleet which are added to the inventory, while deletions, which are a result of vessels being sold for scrap or offshore conversion, are removed from inventory counts. The net result is the ending inventory and the average inventory for the year (beginning plus ending inventory divided by two).
At the start of 2018, the dirty tanker fleet consisted of 2,082 ships. The VLCC fleet begins the year with 711 vessels from an initial 2017 inventory count of 686, a 3.6% increase. The Suezmax segment began 2018 with 562 ships in its trading fleet; a significant increase of 8.7% from 2016’s starting level of 517 vessels.
The second largest dirty tanker fleet by number of vessels, the uncoated Aframaxes, commenced 2018 with 699 ships on the water, representing growth of only 1.0 % year-on-year. Crude carrying Panamaxes totaled 110 at the start of 2018, one ship decrease year-on-year.
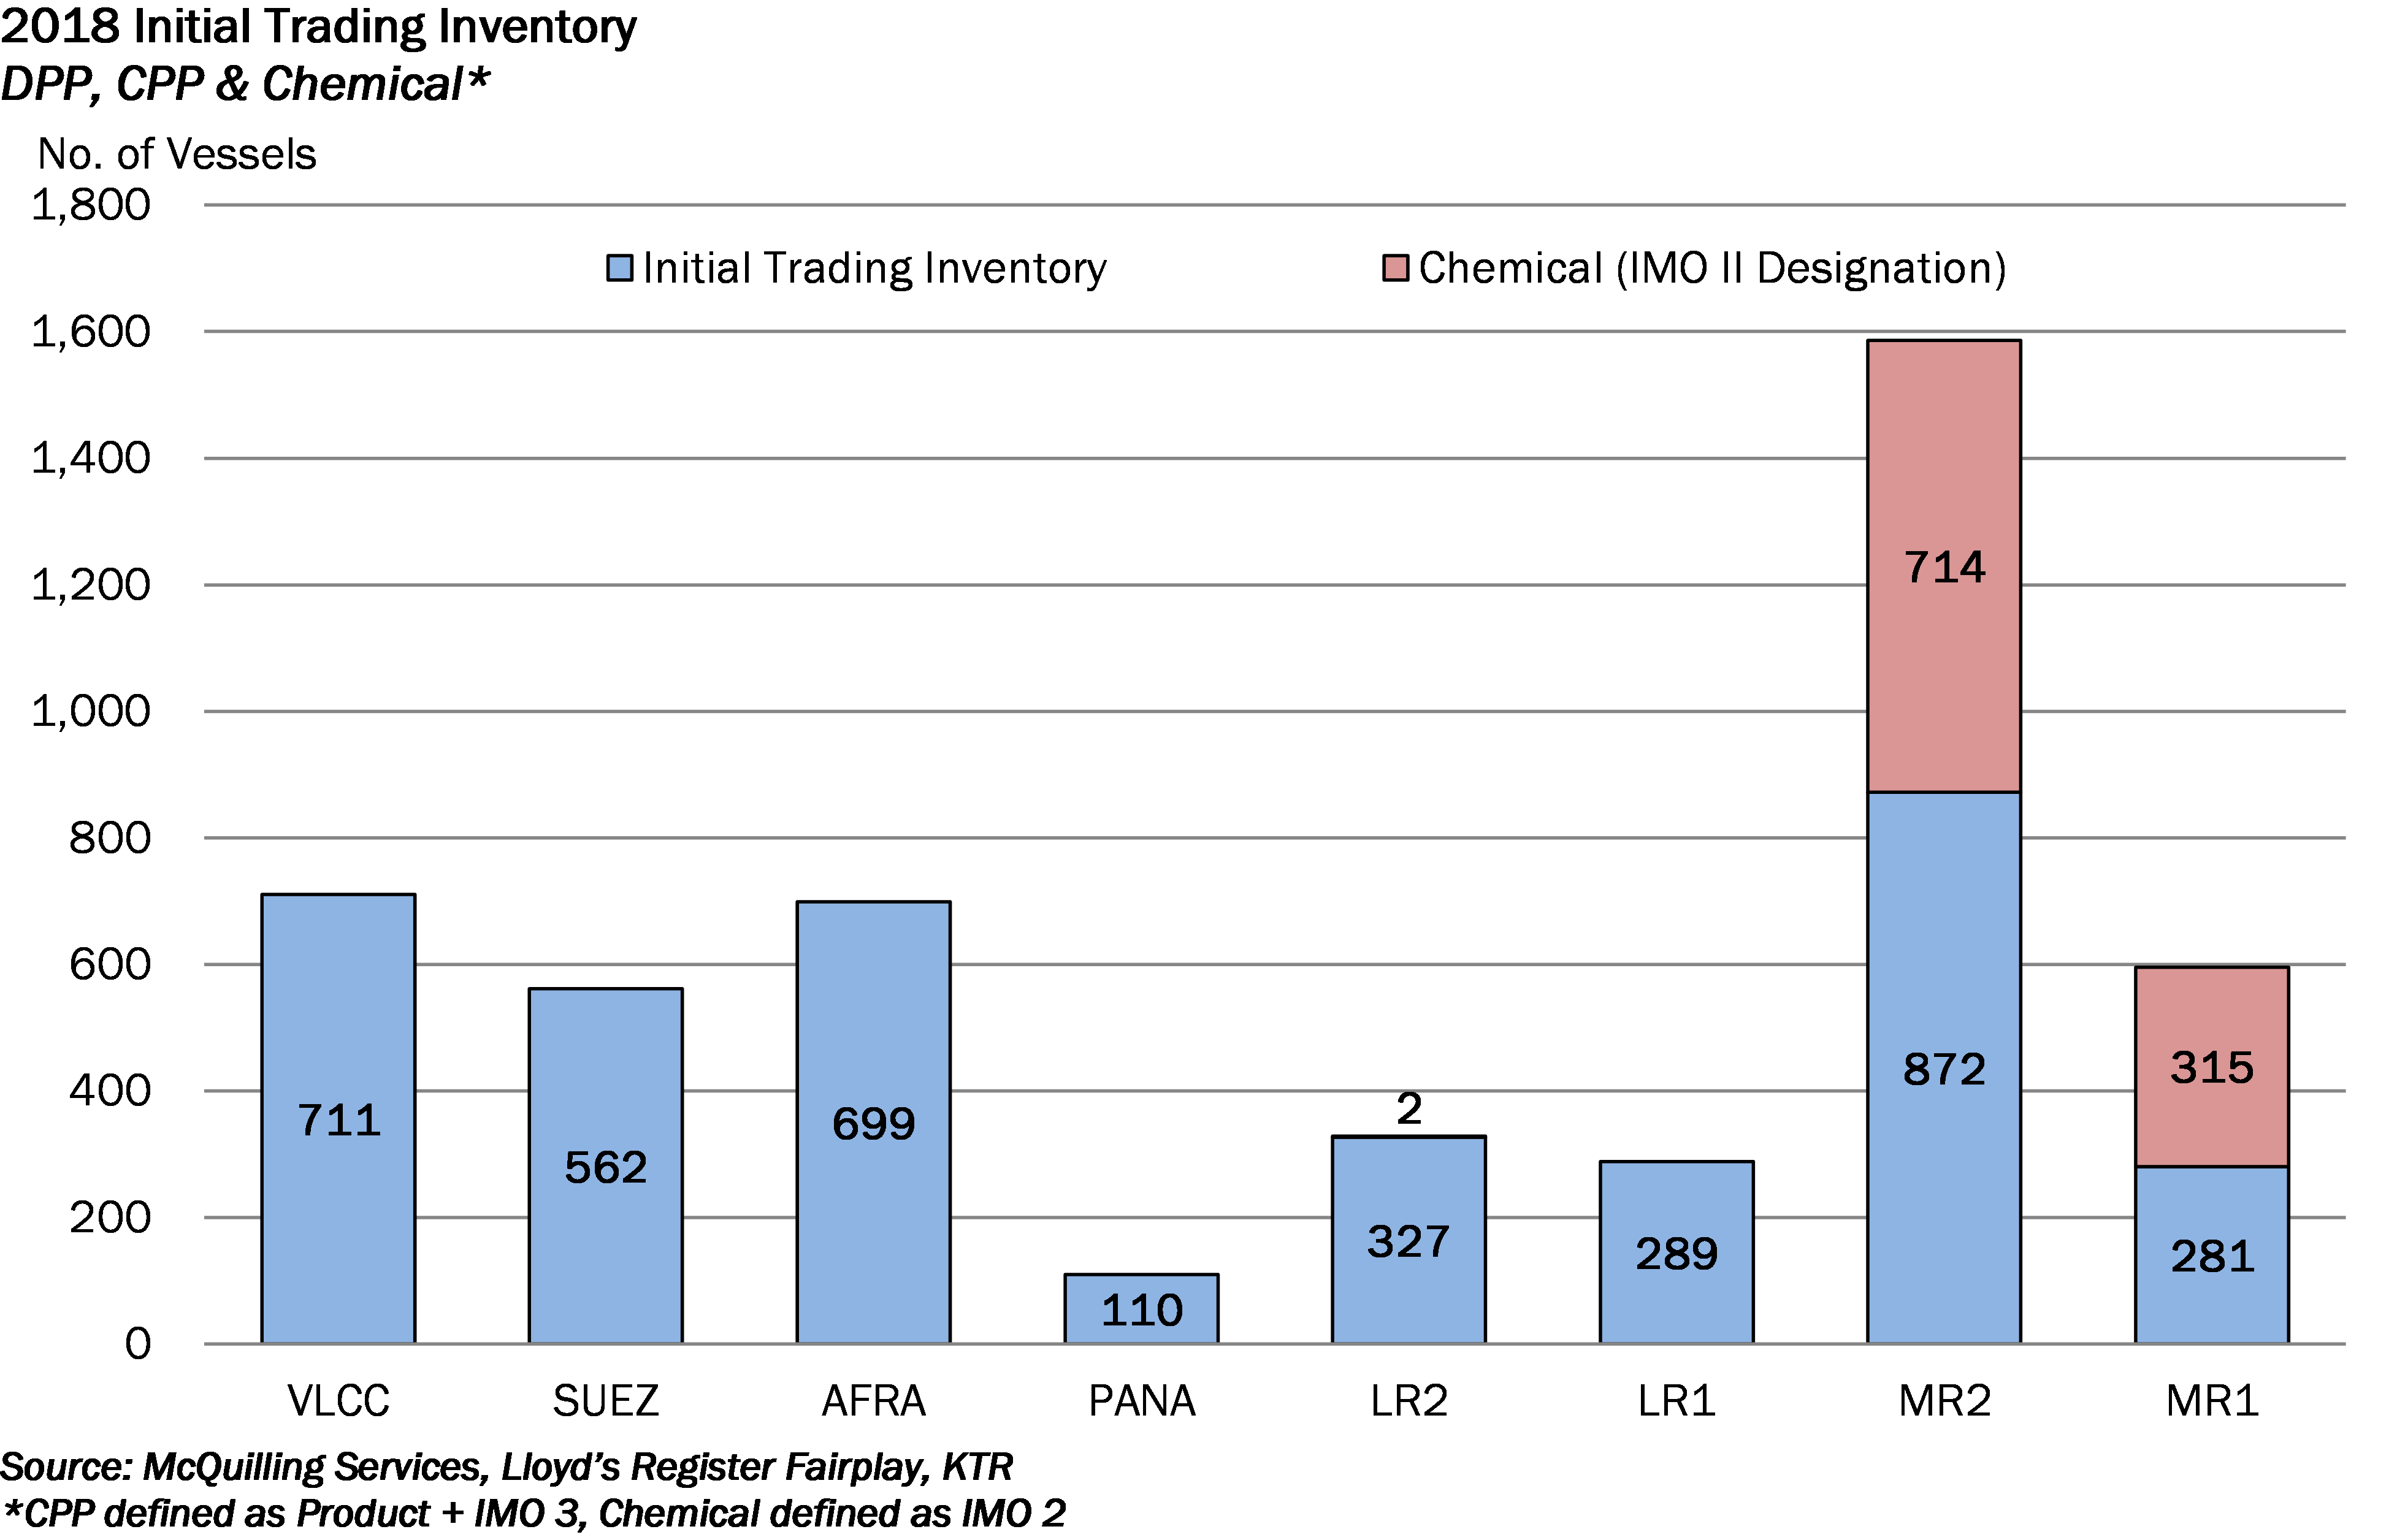
The clean and refined product tanker fleet at the beginning of 2018 totaled 1,769 vessels, excluding vessels with IMO I and II classifications in January 2018. The MR2 class represents about 49% (down from 54% at the beginning of 2017) of the clean tanker fleet with 872 trading vessels on the water. MR2 sized vessels with an IMO II designation at time of writing totaled 714, up from 661 at the beginning of 2017, while chemical MR1 ships increased from 303 to 315 over the same period. At the start of 2018, there were 329 LR2 tankers (2 with an IMO II classification) in service, while we counted 289 LR1 sized vessels, up from 273 vessels at the beginning of last year, a 5.9% increase.

Comments
You need to login to comment.


