


VLCC Utilization Up in November
Dec. 13, 2018
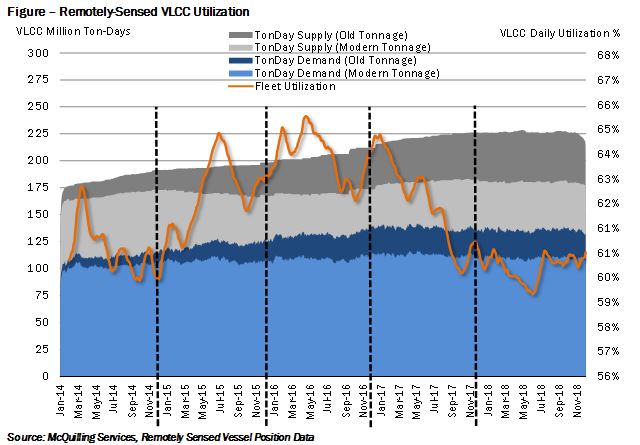
In November, VLCC utilization increased to the highest level observed since the beginning of the year at 60.55%, nearly as high as the level observed in November 2017 (60.58%). Through the first 11 months of the year, utilization has averaged 59.99%, compared to 61.95% in the same months of 2017 (Figure). Although both ton-day demand and ton-day supply decreased month-on-month, the pace of declines in the latter was greater than the former, placing upward support for utilization. Ton-day demand decreased by 1.0% month-on-month in November, a slight acceleration from the prior rate, while ton-day supply decreased by a greater 1.7% month-on-month. On a year-on-year basis, we observed the opposite trend with demand down by 1.8%, while supply was down by only 1.7%. Perhaps what is the most important and telling statistic of the current position in the market is the relationship of ton-day demand and supply in November versus January levels. This indicates that ton-day demand is down about 1.2% compared to January levels, whereas ton-day supply has declined by 1.6%, the greatest decline year-to-date.
When combining VLCC and Suezmax utilization, we note an increasing trend since April 2018; however, with a very slight dip in August. Average utilization came in at 61.02% in November, the highest level observed since the beginning of the year, correlating with the recent run-up of freight rates and TCE earnings. The highest utilization level observed in the month was 61.58%, while the lowest was 60.25%, still above some months in the first half of the year. Despite the bullish trend month-on-month, utilization remains below November 2017 levels and well below November 2016 levels. Over the next month period, we expect utilization to fall as demand tempers on the back of lower import requirements in Asia, while vessels continue to be delivered to the fleet amid lacking incentives to scrap tonnage.
Comments
You need to login to comment.


