Is Shipyard Capacity Running Out?
June 11, 2021
In last couple of weeks, we have taken a deep look at different aspects of tanker fleet development moving forward, essentially arriving to the conclusion that in order for the market to recover, shipowners will have to delete some of their older tonnages and slow down the pace for tanker ordering. Instead, so far in 2021 we have seen a lot of vintage tonnage changing hands for what looks like premium prices as a well as a slew of orders for new tankers. All that while freight rates remain very low and in some cases below OPEX.
Although predicting owner’s decision on scrapping their tonnage is merely impossible, new order activity is somehow capped by the total capacity of global shipbuilding yards. With liner and dry markets climbing to record highs, we have constantly captured new orders for these sectors alongside with heavy tanker ordering activities. These orders, according to a variety of news agencies, have filled yard capacity quickly which suggest a potential slowdown of tanker fleet expansion in the future.
In order to validate this information, we have conducted a shipyard capacity analysis in Asia using compensated gross ton (CGT) as the measuring unit. The CGT system provided a statistical way to evaluate macro-economic shipbuilding workload across major vessel sectors (bulk carriers / oil tankers / chemical tankers / general cargo ships / gas carriers, etc.). Adopting historical yard data from IHS Markit, we first identified the top five shipyards in China, South Korea and Japan and the number of delivered ships or expected delivery in each sector. After that, we used the statistical formula provided in the A NEW COMPENSATED GROSS TON (CGT) SYSTEM – OECD 2007, and aggregated the total CGT for each shipyard from 2010 to 2022. In this analysis, we defined the shipyard capacity as the maximum CGT observed in the last 10 years.
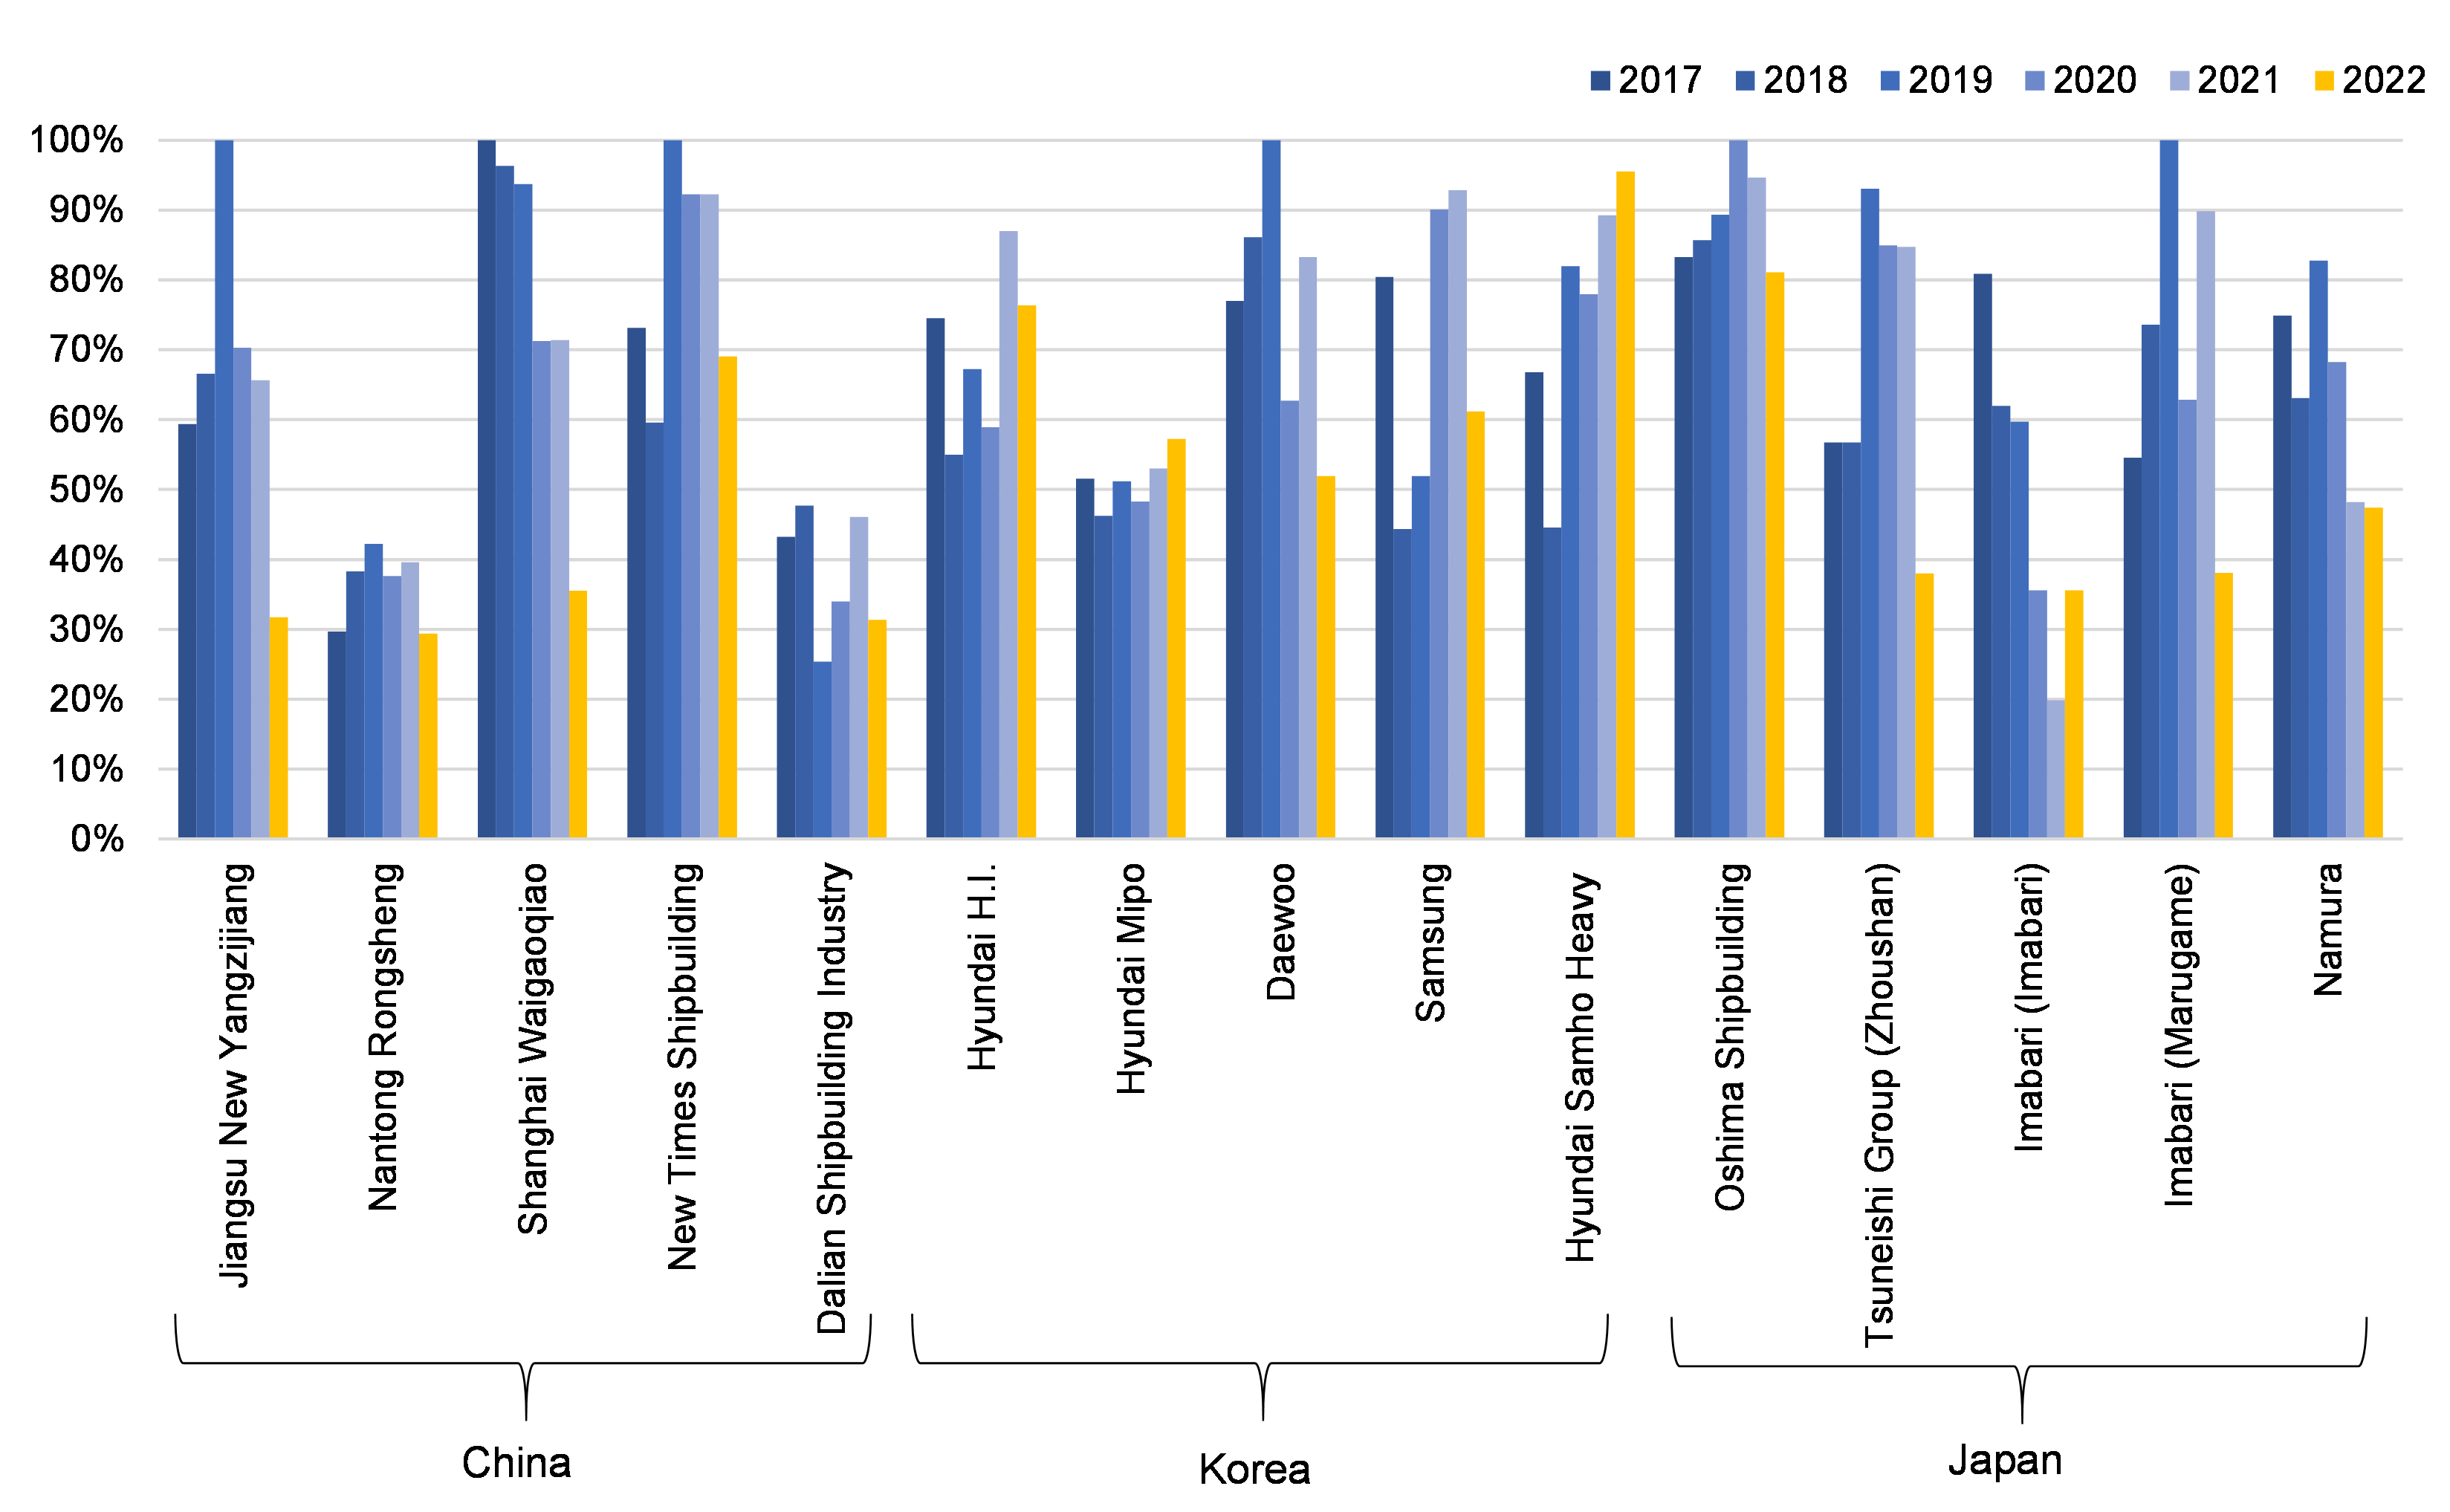
Based on our calculation, the average CGT usage of these 15 shipyards in 2017-2019 was at 68%, with 2019 showing the highest levels at 76%. The average CGT usage in 2020 and 2021 also resulted at 68%, with a surge in 2021 at 71%. Regard to expected deliveries in 2021 onward, we have seen a wide diversity among shipyard in different countries. The usage of Chinese yards currently averaged at 49% for 2022, compared to 63% in 2021. Similarly, CGT usage for top Japanese yards stood at 48% for 2022, 19% lower than the level we observed in 2021. The CGT usage in Korean yards for 2022, based on the current orderbook, has significantly outpaced their peers, with Hyundai Mipo and Hyundai Samho reaching at the peak levels in the last six years. The high utilization at some of the world’s prominent shipbuilders combined with inflationary pressure result in increasing newbuilding prices. For tankers, this could be the turning point for owners to abandon the buying trend amid a depressed market. Along with increased demolitions, it could bring some much-needed supply side relief to the market.
Figure 1 – Shipyard CGT Percentage Compared to Peak Levels

Source: McQuilling Services, IHS Markit


