


LR2 Floating Storage Development
July 17, 2020
Assessing clean products floating storage can be a little challenging during normal times given the increased price sensitivity of petroleum products as it compares to crude oil, as well as technical considerations such as the degradation of some fuels after a 60-day storage period or longer. Despite that, in the past few months the contango structure of the market has signaled some big opportunities and as a result, we saw a strong increase in floating storage on LR tankers, especially LR2s, which are most commonly used for such purposes.
Looking at the latest available data, we see that the big increase in LR2 floating storage came in April, with at least 14 vessels observed entering floating storage, with cargos that were presumably booked in March given it was the month prices started to collapse -along with demand. For the purposes of this analysis, we consider floating storage to include commercial storage as well as operational, which could be the result of delays longer than 14 days. For May, we observed another 14 ships entering floating storage along with at least 4 in June. This brought the cumulative total up to 45 vessels, which we expect will be the peak. Starting in July increased global demand for products is expected to start pushing ships off storage and to discharge ports. Based on the latest data, we project at least 10 ships re-entering the trading fleet by the end of the year (Figure 1).
This high-level analysis clearly shows how, similarly to the DPP sector, the high freight rates we observed from March to May were supported by the supply side of the market as well as transportation demand stemming from collapsing oil and product prices worldwide. At the same time, the current depressed rates in the sector are expected to face even more pressure in the short to medium term given that demand increases and LR2 ships will be steadily returning to trading. We feel that we are now just starting to see the very beginning of this transition, especially when we already know of the existing correlation between floating storage changes and total inventory draws (r sq. of approx.. 70%).
Figure 1 – LR2 Floating Storage Development
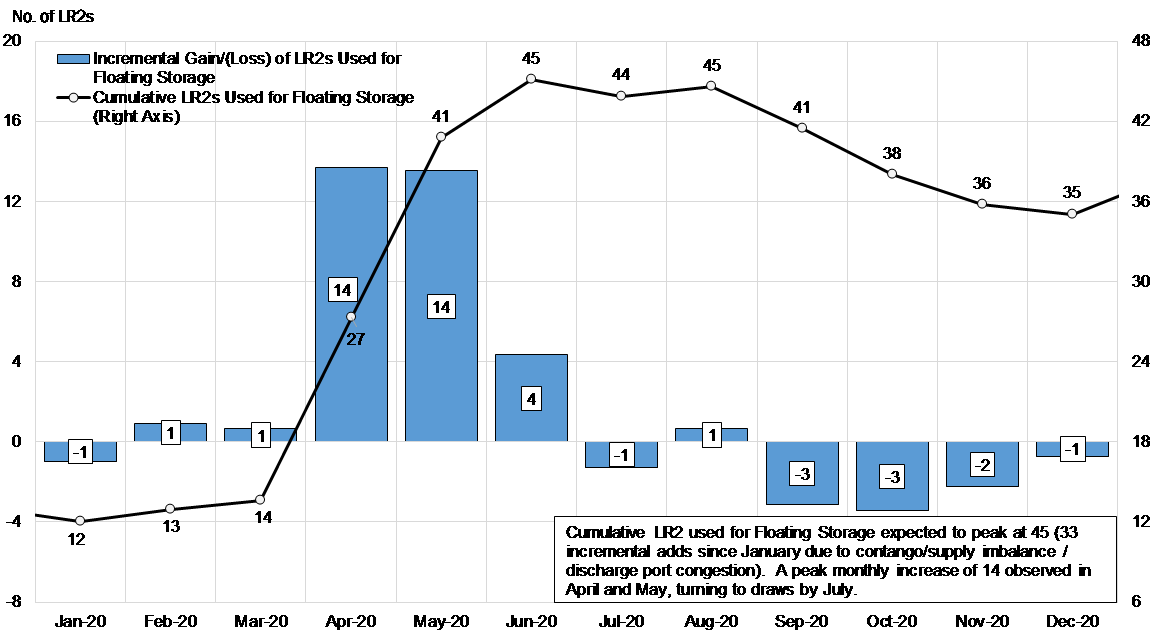
Source: JBC Energy, McQuilling Services
Comments
You need to login to comment.


