


More to Come Down the Road
May 10, 2018
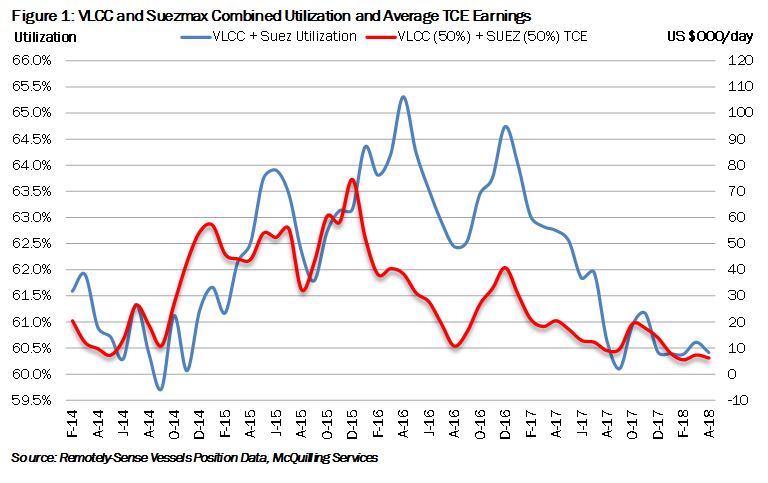
Tanker freight rates have experienced weakness this year as persistent over ordering in previous years come to fruition in the form of an unbalanced market. The fundamental relationship between transport demand and vessel supply truly dictates the direction of the market as our remotely-sensed vessel position data points to declining vessel utilization. Using an exponential regression, we calculate the R Squared of the combined VLCC and Suezmax utilization (independent variable) on the combined TCE earnings to be 0.81, a strong correlation statistic. On an equal weighted average, we note TCEs declined about 70% in the first four months of the year as compared to the same period in 2017. Concurrently, utilization has dropped from 63.2% to 60.5% (Figure 1). Pressure on utilization is likely to persist through the remainder of the year as vessels continue to be delivered to the fleet. We are beginning to see indications that this pressure may last longer-term as the current orderbook continues to expand this year.
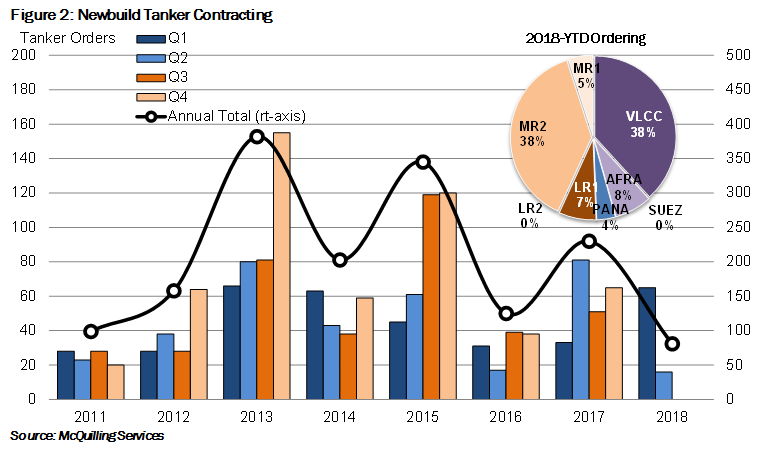
Year-to-date, we have recorded significant growth in newbuild tanker contracting when compared to recent years. Through April, we count 81 tankers (excluding chemical IMO I or II designated), a level somewhat comparable, but still above 2014, when the first four months saw 77 tankers on order (Figure 2). Increased ordering has largely been driven by the VLCC and MR2 sectors as 31 vessels were contracted in each sector, peaking in March. In total, we have observed 40 DPP vessels placed on order, 31 VLCCs, six Aframaxes and three Panamaxes with 0 Suezmax contracts. Looking at the VLCC sector, March was particularly heavy with 18 vessels ordered, with our long-term delivery forecast models projecting 215 VLCCs to hit the water between 2018 and 2022, averaging 54 additions per annum, higher than the 51 expected for this year.
Comments
You need to login to comment.


